 العربية
 English
الرسوم البيانية Data Visualization with Matplotlib & Seaborn
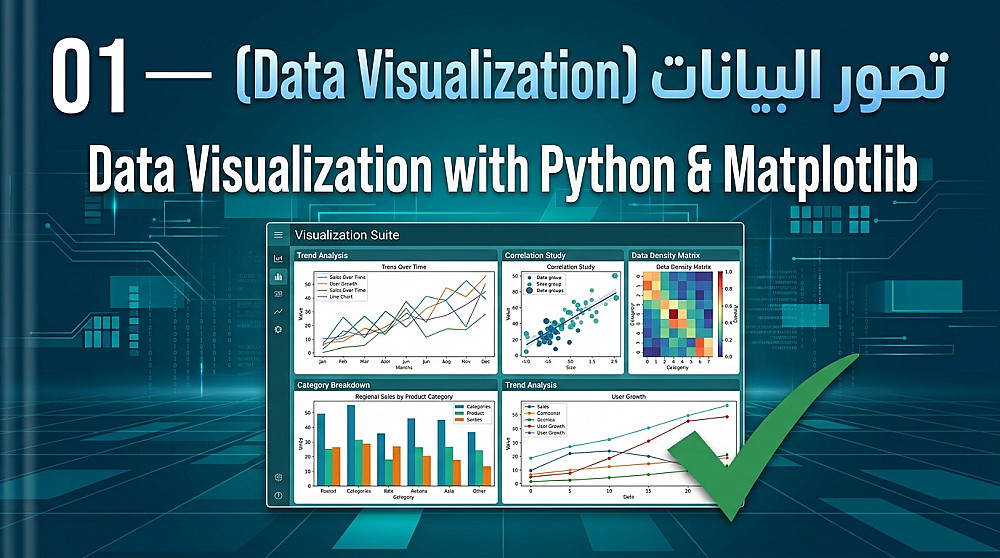
الوصف
**العنوان بالعربي:**
إنشاء رسوم بيانية واضحة لبياناتك باستخدام Python
**Title in English:**
I Will Create Data Visualizations Using Python and Matplotlib
**الوصف بالعربي:**
حوّل جداول البيانات إلى رسوم بيانية واضحة تسهّل فهم النتائج والمقارنة بين القيم.
أستخدم Python ومكتبات Matplotlib وSeaborn لإنشاء رسوم مناسبة لطبيعة بياناتك.
تشمل الخدمة:
- الرسوم العمودية والخطية.
- مقارنة الفئات والمنتجات.
- توضيح التغيرات والاتجاهات.
- إضافة العناوين والمحاور ووسائل الإيضاح.
- تصدير الرسوم إلى PNG أو PDF.
**التسليم:** الرسوم النهائية، مع الكود عند الاتفاق عليه.
أرسل ملف البيانات وحدد ما تريد توضيحه، وعدد الرسوم المطلوبة.
**Description in English:**
Turn your data into clear and useful visualizations.
I create charts using Python, Matplotlib, and Seaborn based on your dataset and goals.
The service can include:
- Bar charts and line charts.
- Category and product comparisons.
- Trend visualization.
- Clear titles, axis labels, and legends.
- Exporting charts to PNG or PDF.
**Deliverables:** Final chart images and Python code when agreed upon.
Please share your dataset, preferred chart types, and the number of visualizations required.

معلومات

خدمات أخري للبائع
الخدمات المقترحه